If you found out that the top 50 authors born in Gloucestershire, England average over 10 million copies sold, you might think that those authors are doing pretty well. But it's silly to compute averages like that. When you compute an average over a population, you're making an assumption that the quantity you're averaging over is statistically distributed somehow over the population. Unless of course you don't care if the average means anything, and you just want numbers to help justify an agenda.
Most folks would look at the list of Gloucestershire authors and say that one of the authors is an outlier, not representative of Gloucestershire authors in general. And so J.K. Rowling, with more than 500 million copies sold, would get removed from the data set, revealing the presumably unimpressive book selling record of the "more representative" authors. Scientists refer to this process as "fudging the data". It's done all the time, but it's not honest.
There's a better way. If a scientific study presents averages across a population, it should also report statistical measures such as variance and standard deviation, so the audience can judge how meaningful the reported averages are (or aren't!).
Other times, the existence of "outliers" is evidence that the numbers are better measured and compared on a different scale. Often, that's a logarithmic scale. For example, noise is measured on a logarithmic scale, in units of decibels. An ambulance siren has a million times the noise power of normal conversation, but it's easier to make sense of that number if we compare the 60 dB sound volume of conversation to the 90 dB of a hair dryer, the 120 dB of the siren and the 140 dB of a jet engine. Similarly, we can understand that while J.K. Rowling's sales run into 8 figures, most top Gloucestershire-born authors are probably 3, 4 and or maybe 5 figure sellers.
Over the weekend, I released a "preprint" on Humanities Commons, describing my analysis of open-access ebook usage data. I worked with a wonderful team including two open-access publishers, University of Michigan Press and Open Book Publishers, on this project, which was funded by the Mellon Foundation. To boil down my analysis to two pithy points, the preprint argues:
For example, if someone tries to tell you that "Engineering, mathematics and computer science OA books perform much better than the average number of downloads for OA books across all subject areas" without telling you about variances of the distributions and refusing to release their data, you should pay them no mind.
Next week, I'll have a post about why logarithmic scales makes sense for measuring open-access usage, and maybe another about how log-normal statistics could save civilization.
Most folks would look at the list of Gloucestershire authors and say that one of the authors is an outlier, not representative of Gloucestershire authors in general. And so J.K. Rowling, with more than 500 million copies sold, would get removed from the data set, revealing the presumably unimpressive book selling record of the "more representative" authors. Scientists refer to this process as "fudging the data". It's done all the time, but it's not honest.
There's a better way. If a scientific study presents averages across a population, it should also report statistical measures such as variance and standard deviation, so the audience can judge how meaningful the reported averages are (or aren't!).
Other times, the existence of "outliers" is evidence that the numbers are better measured and compared on a different scale. Often, that's a logarithmic scale. For example, noise is measured on a logarithmic scale, in units of decibels. An ambulance siren has a million times the noise power of normal conversation, but it's easier to make sense of that number if we compare the 60 dB sound volume of conversation to the 90 dB of a hair dryer, the 120 dB of the siren and the 140 dB of a jet engine. Similarly, we can understand that while J.K. Rowling's sales run into 8 figures, most top Gloucestershire-born authors are probably 3, 4 and or maybe 5 figure sellers.
Over the weekend, I released a "preprint" on Humanities Commons, describing my analysis of open-access ebook usage data. I worked with a wonderful team including two open-access publishers, University of Michigan Press and Open Book Publishers, on this project, which was funded by the Mellon Foundation. To boil down my analysis to two pithy points, the preprint argues:
- Free ebook downloads are best measured on a logarithmic scale, like earthquakes and trade publishing sales.
- We shouldn't average download counts.
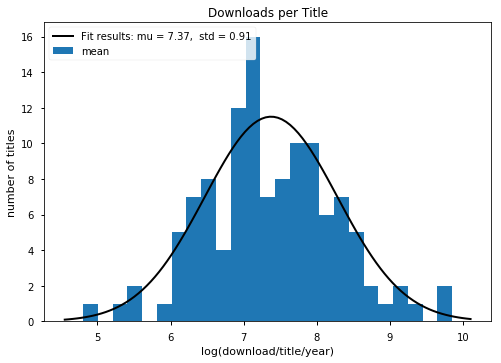 |
| If you take the logarithm of book downloads, the histogram looks like a bell curve! |
Next week, I'll have a post about why logarithmic scales makes sense for measuring open-access usage, and maybe another about how log-normal statistics could save civilization.

